About Bolster AI Signals
Overview of the Signals Feature
Part of the Bolster platform, Bolster AI Signals uses advanced LLMs to help your security team see, understand, and act on emerging attacker infrastructure before it becomes weaponized.
Signals combines data coverage, analytics, and AI-powered interaction in the following ways:
- Fraud pattern detection – Identifies attacker infrastructure and brand-abuse activity on the web.
- Predictive threat modeling – Surfaces early indicators of attacker behavior based on external signals.
- Benchmarking – Compares fraud trends and takedown performance across industry peers as well as globally.
- Summaries and reports – Provide intelligence and visibility through shareable PDF and PPT files suitable for executive audiences.
- Ask Bolster – Allows teams to query the data in plain language, unlocking deep insights through a simple AI chat interface.
To access the Signals page, select Signals in the top navigation bar.
Signals Analytics
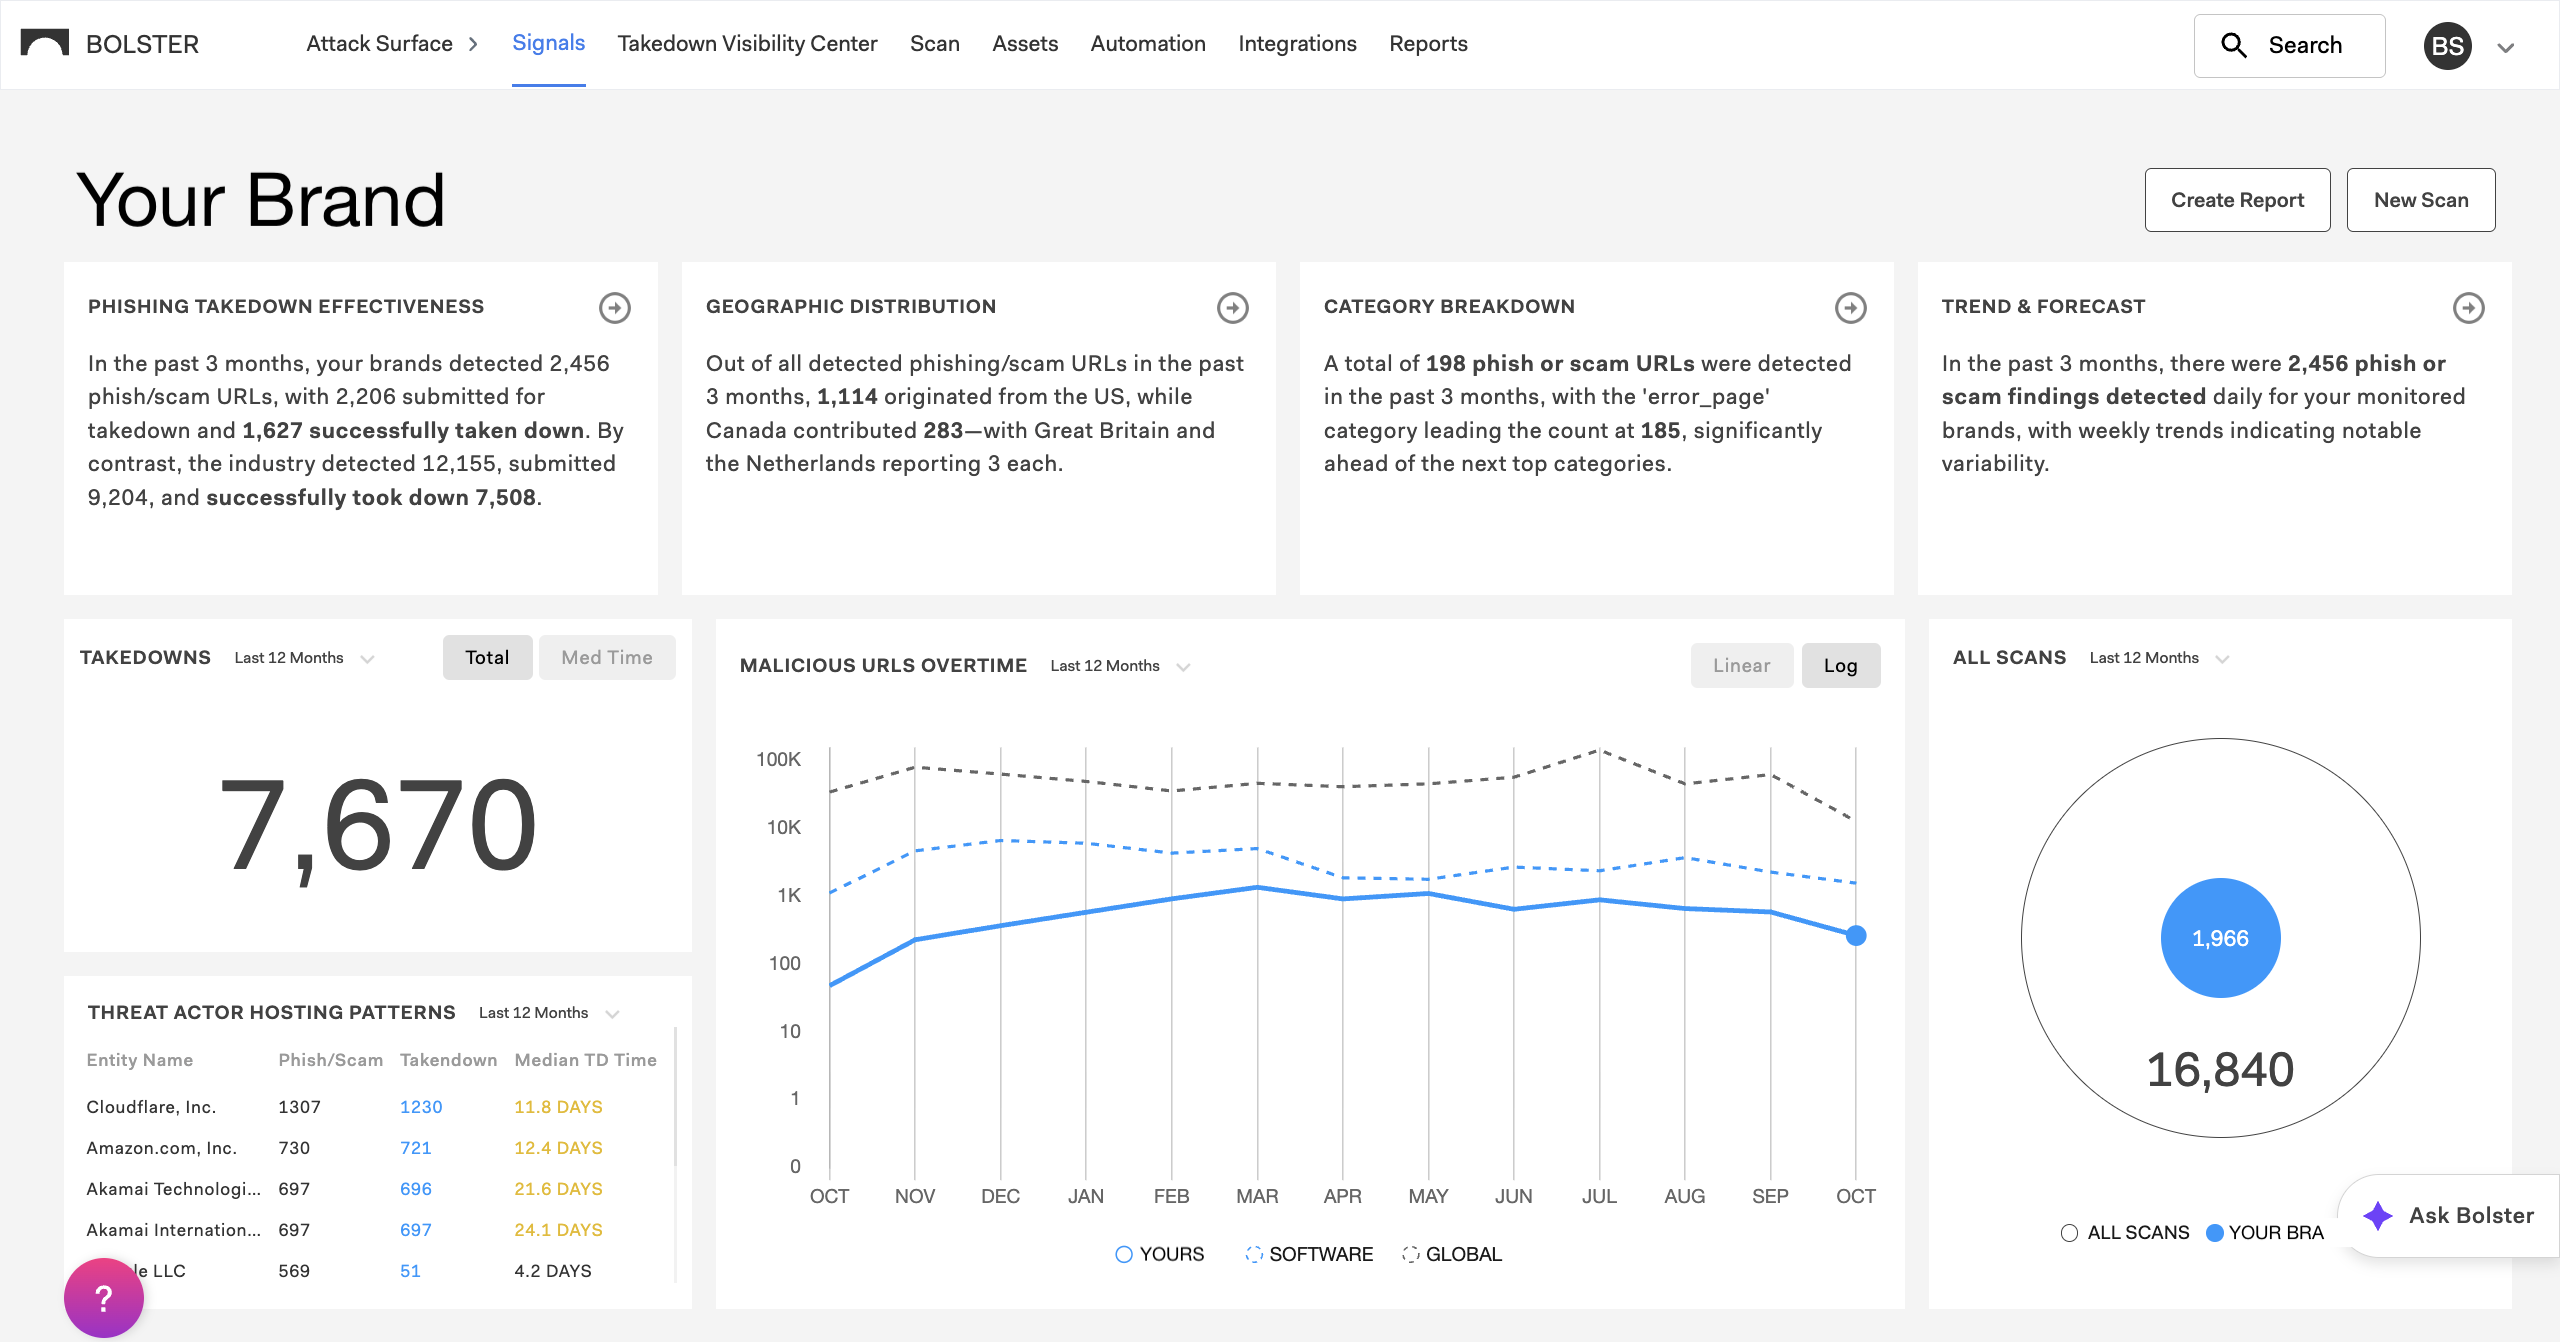
From the Signals page, security teams can monitor fraud trends, benchmark activity, and view takedown performance over time. Available data includes:
- AI-generated insights – Shows you the most important data for your brand.
- Takedown activity – Tracks removals and resolutions.
- Malicious URLs over time – Shows detection volume and trend lines.
- Scan results breakdown – Filterable by category, source, and time period.
- Threat actor hosting patterns – Spotlights recurring threat infrastructure.
- Action timeline – Traces detected threats from discovery through takedown.
How to Use Bolster AI Signals
Follow these steps to investigate your brand’s external threat data:
- Select Signals in the Bolster top navigation bar to access the feature.
- Review the top row widgets to see four critical AI-generated insights about your brand, with comparisons to peers and globally, and click through for more detail.
- Back on the main Signals page, explore more fraud and threat-convergence data widgets.
- Select Scans and drill down into detailed scan data to analyze trends.
- Select Actions to see a visual timeline of all events related to that URL.
- Use the AI assistant (Ask Bolster) to pose open-ended questions or drill into specific data points.
- Create reports to compile, visualize, and share findings as PDF or PPT files.
- Use these insights to prioritize takedowns and communicate results across teams.
To learn more, see Using the Signals Page.
Enterprise Outcomes
As Signals surfaces patterns across domains and benchmarks them against industry peers, typical outcomes for enterprises include:
- Faster investigations and shorter takedown cycles.
- Comparative context that shows if threats are unusual relative to industry or global activity.
- Executive visibility with a consolidated display and shareable reports.
- Cross-functional value as each team can view risk through its own lens while sharing one intelligence backbone.